DIY Real time mains power meter
If you have rather fancied the nifty "in house" real time power use monitors that come with some "smart" meters, but don't fancy the rest of the smart meter, this simple project will get you some of the same functionality.
Background
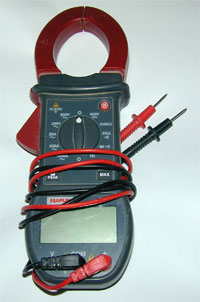
A quick "rough and ready" estimate of your power use can be obtained with a digital "clamp" meter. This will make a "non contact" reading of the current passing through a wire. So if you clamp it round one of the "tails" that connect your electricity meter to your Consumer Unit (CU), you will get a reading of the current flowing at that moment. Multiply that number by your mains voltage (typically 240V), and you will have a an indication of the total power in watts being used.
Now this may be all you need. Aside from the "faff" of digging out a clamp meter each time, there are also a couple of sources of inaccuracy in this approach. To assess the actual power being used, you need to know the actual voltage as well as the current, so ideally we need to measure this rather than just assume it is 240V since not only will each property likely vary a little from the "normal" voltage anyway, it will fluctuate throughout the day as the load on the supply changes.
The second source of error is that the multiple of volts and amps when dealing with AC rather than DC, does not actually get you Watts, but "Volt Amps" or "VA". The VA reading is the total "apparent power" being used. This may be different from the real power being actually consumed because some part of the electrical load may be "reactive" - i.e. where a load stores some energy on part of the mains cycle, but then releases it later. This means not all of the current you can measure amounts to energy you actually need to pay for. See the article on power factor for a fuller explanation of this.
Depending on what you need to know, this may or may not matter. For knowing what size cables are required for a given load or what size UPS is required to keep your computer running during a power cut, the VA is the more useful number, since you need to know how many amps you need to allow for. For working out your energy use or costs, you will need the real power consumption in Watts and not the VA, since domestic electricity meters only charge for the real power consumed.
Design
This project was a simple "proof of concept" to see how well the monitor would work. (It may be followed by a multi channel mains power consumption meter with data logging, but that is for later!). So we need a way to measure the real time mains voltage, and the real time current consumption. This needs to be done in a safe and easy way that does not require wiring into the electrical system.
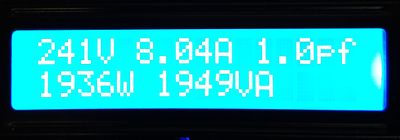
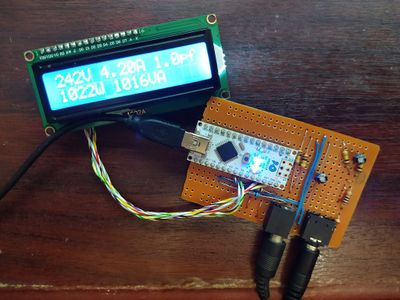
Using a 9V or 12V AC/AC mains power adaptor (basically a small transformer, in a box with a plug on it, and if we are lucky a thermal fuse), gives a low voltage supply that we can measure the voltage of. Power supplies with an AC output are less common than the typical DC ones, but were commonly used with many "dial up" modems, so there is a fair chance there is one stuffed in a drawer somewhere. We need a clip on current transformer to act as our clamp meter, and let us measure the current in the meter tail feeding the CU. Lastly we need a small amount of computing power to collect the voltage and current readings, do some number crunching, and send out the information we need to a local display. For this I used a Arduino "nano" clone, and a 16x2 line LCD display with back light. The Arduino and LCD are powered from a normal phone charger plugged into the USB socket on the end of the Arduino.
Circuit and theory of operation
Reading the mains voltage
The AC adaptor will give us a low voltage supply where the voltage will vary in sympathy with the mains voltage. So we can measure this as a proxy for measuring the mains voltage. To do this we need to first capture the output from it with an Analogue to Digital Converter (ADC). The ADC channels on the Arduino can measure any analogue voltage between 0V and the supply voltage (typically 5V), and digitize with 10 bits of resolution. The Arduino can take lots of ADC samples quickly (over 2500/sec), so it can capture the voltage waveform with quite a fine resolution.
We can't use the output from the adaptor directly, because the peak voltage will exceed the maximum the ADC can read, and there is also a negative component of the waveform which will be below the minimum voltage level of the ADC. So we need to do some conditioning first. There are two parts to this. Compressing the voltage to a smaller range, and adding a constant DC bias to it so that we never see the negative going component of it.
A 9V AC transformer will give 9V RMS when under some load. Without any load the voltage will tend to rise a bit. So to be on the safe side we shall assume it could be 20% more than the nominal 9V. We also need to allow for the mains voltage to be higher than the nominal 240V. The upper limit is normally taken as 230V + 10% (i.e. 253V). Lastly the specified voltage is the RMS (i.e. the DC equivalent) voltage, we need to know the full range of values that our ADC will see. This will be the "peak to peak" voltage. So to find the max output due to a high mains input:
Allow for 20% voltage rise on unloaded transformer:
Now convert that to its peak value:
Since we need to be able to capture the entire waveform, we need to capture a "peak to peak" voltage range of 32.2V (i.e. twice the peak)
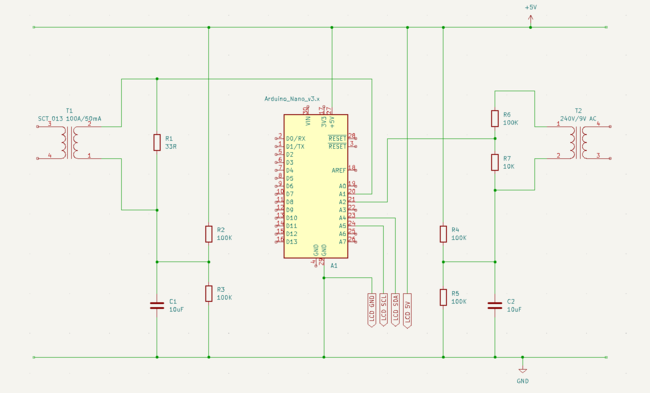
Just to be on the safe side we should assume that the Arduino may be running at the lower end of its typical supply voltage of 4.8V, restricting the total range of the ADC a bit. The upshot of all this is we now know that we need to take a waveform that can span a bit over 32V and squash it into a voltage range of 4.8V. We also need a bit of "slack" so we don't risk going under or over voltage on the ADC. One way to do this is with a pair of resistors acting as a potential divider like R5 and R6. If we measure the voltage from the middle of the pair, the exact value will depend on their ratio. The values for both want to be fairly high since we don't want to pass any significant current though them or load on the AC transformer (the input to the ADC will draw practically none itself). So if we have a ~32V range, using a 10:1 ratio sounds about right. A 100K resistance + a 10K resistance will give 110K total, and ohms law will tell us that at 11.39V RMS, that would be a load of 11.39/110,000 = 0.1mA.
So R6 and R7 will scale the peak to peak voltage to:
So the output from the R6/R7 potential divider will be 2.93V Peak to Peak, or 1.46V peak, or 1.03V RMS,
C2 will create an AC path to the Arduino's ground reference. So the last thing to do it use R4 and R5 to form a second potential divider - this time with equal values to get exactly the mid point of the Arduino's supply voltage, that will add a DC bias of half the Arduino's supply voltage to the ground referenced side of the transformer's output. So the ADC should see a voltage waveform that can swing between i.e. between approx 1 and 4V. This will make good use of the available ADC resolution. It is a 10 bit device, so it can a range of 1024 possible digitized values. We are using 3/5ths of that range - so about 615 possible output values. So we should be able to see changes in voltage from the adaptor as little as 5mV (peak to peak). That is around 1.8mV RMS. This will let us read the actual mains voltage to around 0.5V (RMS) accuracy, which should be plenty good enough.
Reading the mains current
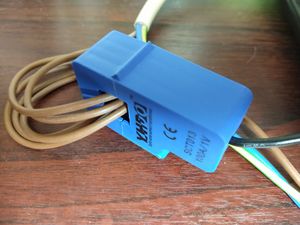
The current is sensed by a YHDO SCT 013 current transformer with a 100A maximum reading. These are available in two versions. One that at the full 100A reading will generate a 50mA current output, and one that will generate a 1V voltage output. The difference is that the voltage output type includes an internal burden resistor across the output of the transformer's secondary coil, to allow the meter to read a voltage directly. My one was a voltage output type, however to get a bit more resolution from it, I opened it and removed the internal burden resistor, so that I could turn it into the current output version,and then use my own burden resistor to scale the output to better match my ADC range. We also have one of the same problems we had with the voltage input - that the waveform we will see is bipolar with a negative going part of each cycle. So R1 at 33 Ohms will show a potential difference across it of:
R2 + R3 act as a potential divider and add a bias of half the Arduino supply voltage to side of the transformer coupled to the Arduino earth reference by C1.
That is all the electronics dealt with.
Building it
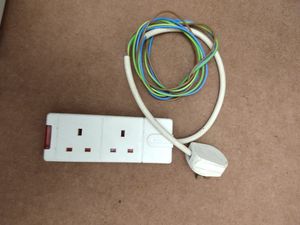
The first build was quickly put together on a breadboard, and some measurements made of the scaled and biased current and voltage readings to check they were within the required range. I used a 1/2kW fan heater as a dummy load, and then tested higher currents by looping extra turns of the supply wire through the current transformer to make it see a higher current.
Note on safety: current transformers without an internal burden resistor can generate a high touch voltage on the secondary if they are not terminated into some kind of load. So normally one should ensure that the current transformer itself and any single-insulated mains wires are fitted into an enclosure with appropriate strain relief glands, etc.
The particular unit chosen is fully enclosed and also does include additional circuitry to limit the output voltage, so the fact that it presents its output on a 3.5mm jack plug does not pose a risk in this circumstance.
Once happy with the component values selected, I drew up the circuit diagram in KiCad, and then built a neater version on some stripboard. The display selected was a standard 16x2 line LCD with back light, however it also had an I²C interface adaptor on the back that means you only need power plus serial data and clock, rather than a 6 or 10 wire parallel connection. (We are not short of spare IO pins here, but less connecting wires to get into the project case would be nice!)
Moving to a stripboard, ought to be easy, but in this case I found I was getting very odd looking readings. After spending some considerable time checking it against the circuit diagram, buzzing out connections and checking component values, I could not find anything wrong, there were no errors in the construction, and it matched the circuit diagram faithfully. However it was almost like the current and voltage readings were transposed since the voltage seemed to rise with load, the current was showing a steady 85A almost regardless of load, but the power figure looked about ok.
Then the penny dropped... when drawing out the circuit I initially placed both transformers on the right of the circuit diagram, before deciding that it looked a bit cluttered. So I moved the CT to the left. The only problem with that was it then put an unwanted crossover in the ADC lines. Hence I swapped them in the design. Alas not in the software which was built for the breadboard version of the layout. One very simple code change later and it works.
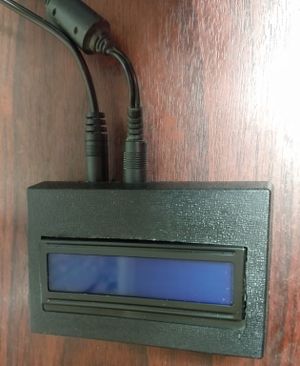
I had a small plastic project case, which was just about big enough to get the LCD in (if I snipped off most of the connection pins on the back of the LCD adaptor board, and soldered the wires direct to the stumps!)
I cut out a rectangle in the face with a small saw blade in a multitool, and fixed things in place with hot glue. The LCD and the circuit board almost meet each other top to bottom when in the case, so I added some insulating tape as a shield between them before doing up the two halves.
Software
The software for this leans heavily on the open source EmonLib library. This handles all of the more complicated real time capture of the voltage and current waveforms, and does the required real time computations. It enables the monitor to get accurate measurements even with "problematic" loads like those caused by Switched Mode PSUs, zero crossing lamp dimmers which would cause more conventional averaged voltage and current product types of computation to over read the actual power consumption.
The library also takes care of a few other details like reading the ADCs, adjusting for the slight time delay between the voltage and current reads (ideally these would happen simultaneously - but the hardware does not permit that, so they must be in sequence. This will show up in a slight phase measurement error unless corrected for), filtering out the DC bias from the readings introduced by the electronics to make the bipolar waveforms palatable to the ADCs 0V to 5V input range. .
This means the actual application code is trivial. The setup function initialises the LCD, and tells the emon lib which pins are hooked up to the voltage and current sources. It also need supplies some calibration constants. Note: you may need to tweak these to account for different current transformers or burden resistors. You can either work out the values from first principles or can take the more empirical approach of making measurements with a multimeter, and then tuning the calibration values to make the software readings match the measured ones.
A worthwhile refinement might be to add a rotary encoder, to allow the calibration values to be tuned while running rather than pre-set at compile time. Adding real time logging will come in a future expansion.
The Code
/**
 * Basic energy monitor
 *
 * This is a very simple energy monitor designed to report the instanatneous
 * main RMS Voltage, Current, Power consumption (real and apparent) and
 * calculate the power factor.
 *
 * The results are updated periodically on a 16x2 line backlit LCD display connected
 * via an i2c bus.
 *
 * Based on code from:
 *
 * EmonLibrary examples openenergymonitor.org, Licence GNU GPL V3
 *
 * Version History
 * ===============
 * V 1.0    Nov 2022    J Rumm    First release
 *
 */


#include <LCD_I2C.h>            // Replacement of LiquidCrystal library with i2c varient
#include "EmonLib.h"            // Include Emon Library

LCD_I2C lcd( 0x27 );
EnergyMonitor emon;


void setup()
{
  // Initialise LCD
  lcd.begin();
  lcd.backlight();
  lcd.clear();

  // Set calibration parameters. For detail see:

  // https://learn.openenergymonitor.org/electricity-monitoring/ctac/ct-and-ac-power-adaptor-installation-and-calibration-theory

  emon.voltage(2, 239.0, 1.7);  // Voltage: input pin, calibration, phase_shift (Adjust to 188.5 for 12V adaptor)
  emon.current(1, 65.0);        // Current: input pin, calibration.
}


void loop()
{
  char topline[20] ;
  char botline[20] ;
  char volts[10];
  char amps[10];
  char watts[10];
  char va[10];
  char pf[10];

  emon.calcVI( 20, 2000 );         // Calculate all. No.of half wavelengths (crossings), time-out

  // Format results into C style strings (Arduino/avr version of sprintf does not handle floating point conversions)
  dtostrf( emon.Vrms, 3, 0, volts );
  dtostrf( emon.Irms, 3, 2, amps );
  dtostrf( emon.realPower, 0, 0, watts );
  dtostrf( emon.powerFactor, 0, 1, pf );
  dtostrf( emon.apparentPower, 0, 0, va );

  sprintf( topline, "%sV %sA %spf", volts, amps, pf );
  sprintf( botline, "%sW %sVA  ", watts, va );

  lcd.setCursor(0,0);
  lcd.print( topline );
  lcd.setCursor(0,1);
  lcd.print( botline );

  delay( 1000 );
}